
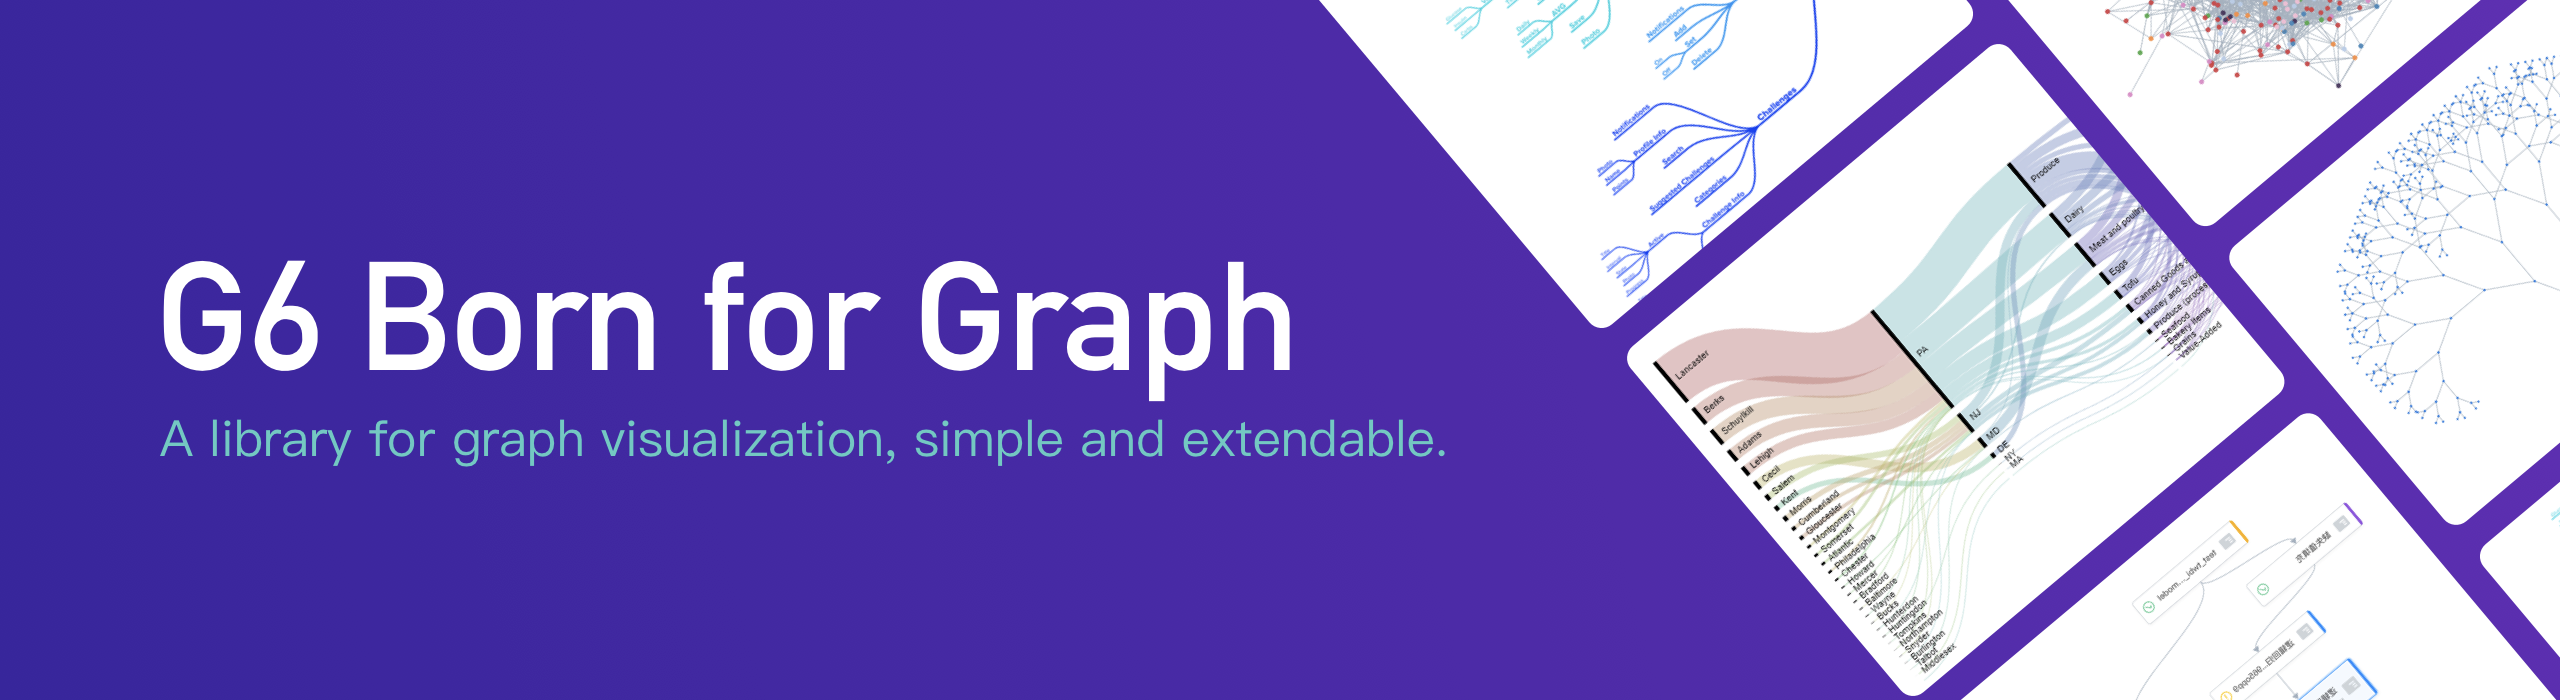
G6 是一个图可视化框架。它提供了一套图可视化的基础设置,能帮助开发者搭建属于自己的图 图分析 应用或是 图编辑器 应用
https://antv.alipay.com/zh-cn/g6/3.x/demo/index.html
 Moyee
a5b93503a8
Merge pull request #824 from antvis/dev3.0.5
Moyee
a5b93503a8
Merge pull request #824 from antvis/dev3.0.5
|
6 vuotta sitten | |
|---|---|---|
| .github | 7 vuotta sitten | |
| bin | 6 vuotta sitten | |
| demos | 6 vuotta sitten | |
| plugins | 6 vuotta sitten | |
| src | 6 vuotta sitten | |
| test | 6 vuotta sitten | |
| .babelrc | 6 vuotta sitten | |
| .editorconfig | 7 vuotta sitten | |
| .eslintignore | 6 vuotta sitten | |
| .eslintrc | 7 vuotta sitten | |
| .gitignore | 7 vuotta sitten | |
| .gitlab-ci.yml | 6 vuotta sitten | |
| .npmignore | 7 vuotta sitten | |
| .torch.compile.opts.js | 6 vuotta sitten | |
| .travis.yml | 6 vuotta sitten | |
| CHANGELOG.md | 6 vuotta sitten | |
| CONTRIBUTING.md | 7 vuotta sitten | |
| CONTRIBUTING.zh-CN.md | 7 vuotta sitten | |
| LICENSE | 7 vuotta sitten | |
| README-zh_CN.md | 6 vuotta sitten | |
| README.md | 6 vuotta sitten | |
| package.json | 6 vuotta sitten | |
| webpack-dev.config.js | 7 vuotta sitten | |
| webpack.config.js | 6 vuotta sitten |
README-zh_CN.md

![]()
![]()


![]()
G6 是一个图可视化框架。它提供了一套图可视化的基础设置,能帮助开发者搭建属于自己的图 图分析 应用或是 图编辑器 应用。 详情请见开发文档。


G6-Editor


G6-Analyzer [coming soon]

安装
$ npm install @antv/g6

Usage
import G6 from '@antv/g6';

  const data = {
  nodes: [{
    id: 'node1',
    x: 100,
    y: 200
  },{
    id: 'node2',
    x: 300,
    y: 200
  }],
  edges: [{
    target: 'node2',
    source: 'node1'
  }]
};
const graph = new G6.Graph({
  container: 'mountNode',
  width: 500,
  height: 500,
  nodeStyle: {
    default: {
      fill: '#40a9ff',
      stroke: '#096dd9'
    }
  },
  edgeStyle: {
    default: { stroke: '#A3B1BF' }
  }
});
graph.read(data);
开发
$ npm install

# run test case
$ npm run test-live

# build watching file changes and run demos
$ npm run dev
如何贡献
请让我们知道您要解决或贡献什么,所以在贡献之前请先提交 issues 描述 bug 或建议。
成为一个贡献者前请阅读 代码贡献规范.